iri2016
IRI2016 ionosphere model from Python and Matlab
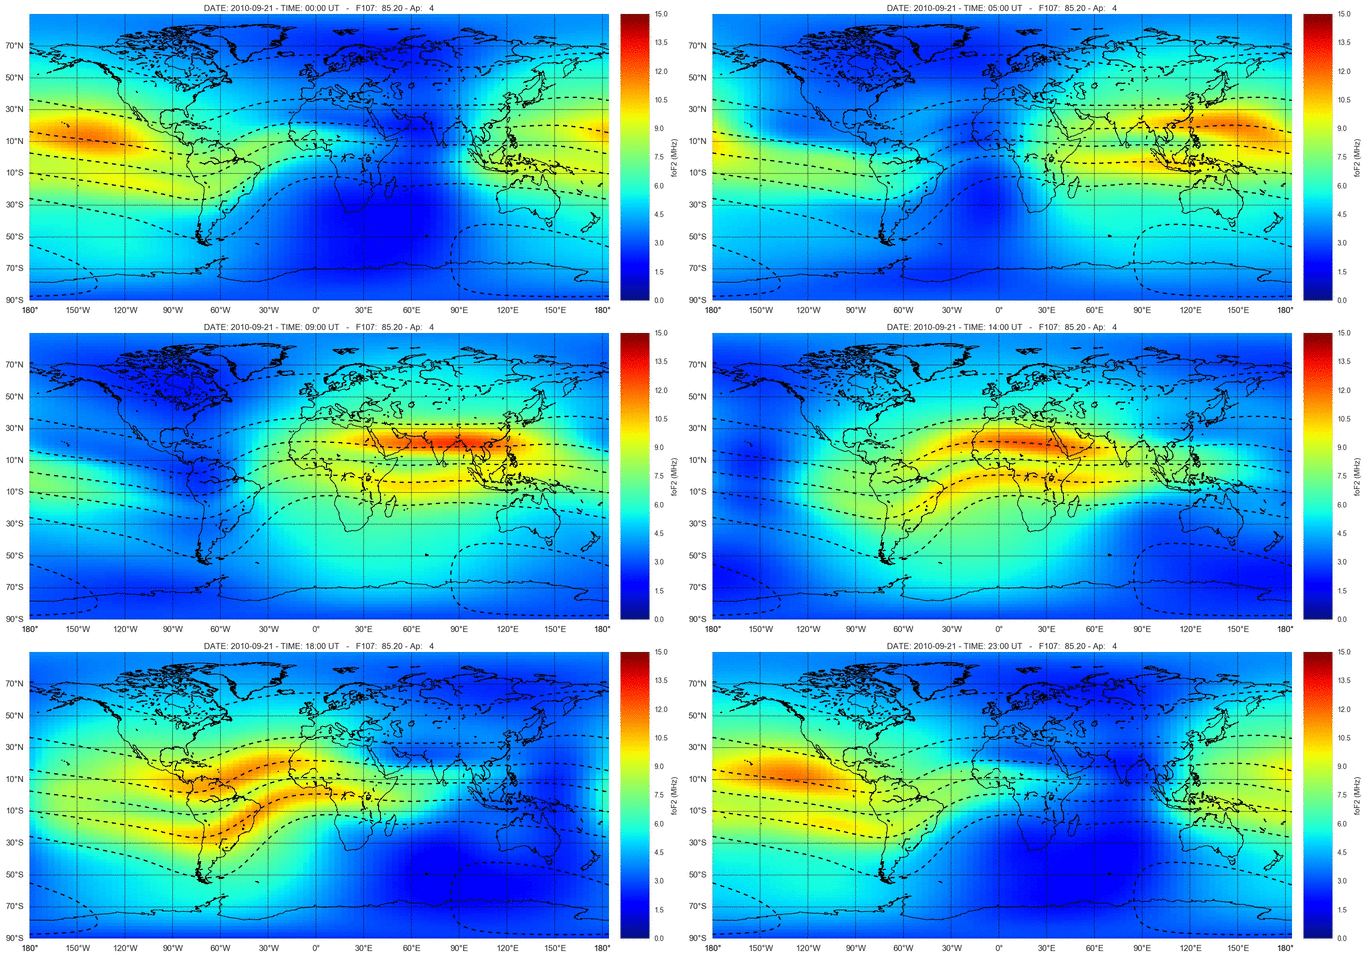
Python and Matlab interfaces to the International Reference Ionosphere (IRI) 2016 model. A Fortran compiler is required to build the IRI2016 code.
Install
Prerequisites
- Fortran compiler–any modern Fortran compiler will do. Here’s how to get Gfortran:
- Linux:
apt install gfortran - Mac:
brew install gcc - Windows: consider MSYS2
- Linux:
and then install latest release:
pip install iri2016
if you want the latest development version:
git clone https://github.com/space-physics/iri2016

pip install -e iri2016
This Python wrapper of IRI2016 uses our build-on-run technique.
On the first run or iri2016.IRI() the Fortran code is built–we call this “build on run”.
If you have errors about building on the first run, ensure that your Fortran compiler is specified in environment variable FC–this is what most build systems use to indicate the desired Fortran compiler (name or full path).
Usage
-
Altitude Profile: plot density and temperatures vs altitude
python -m iri2016.altitude 2003-11-21T12 -11.95 -76.77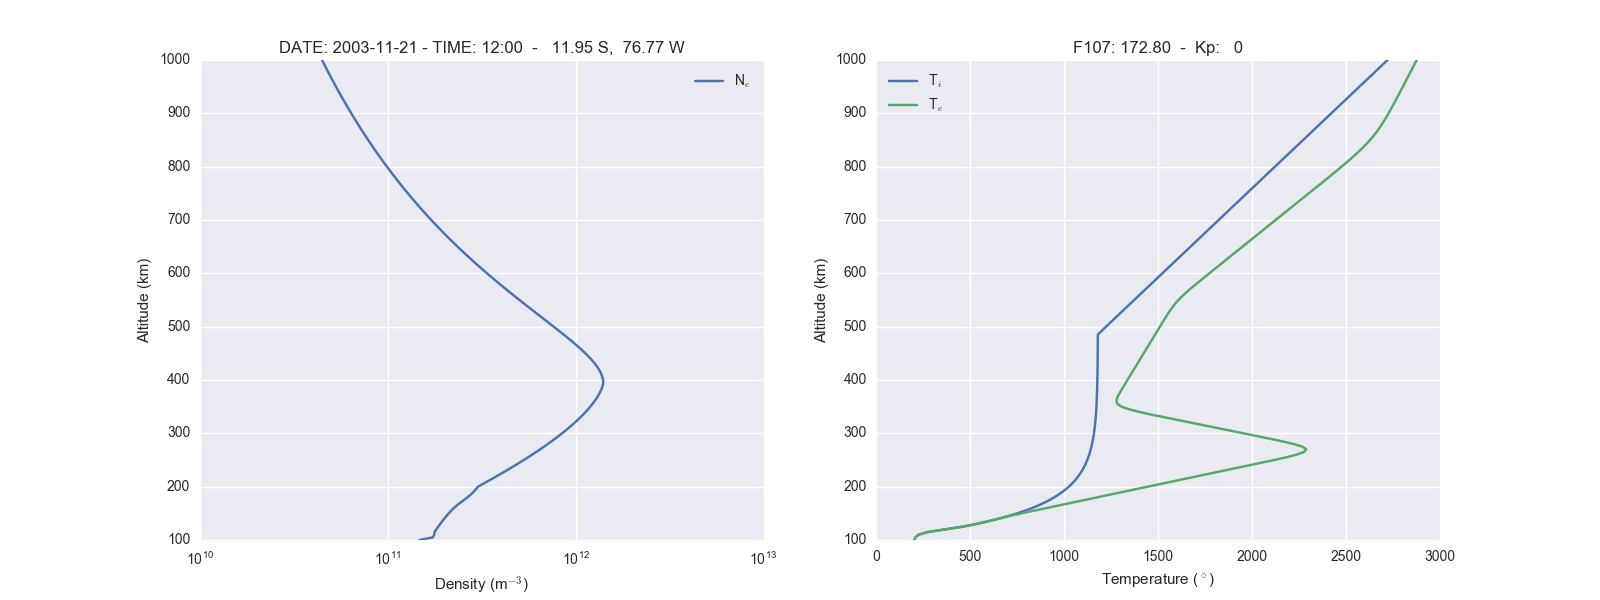
-
Latitude profile: plot densities and height at the peak of F2, F2, and E regions vs geographic latitude
python -m iri2016.latitude 2004-11-21T17 -76.77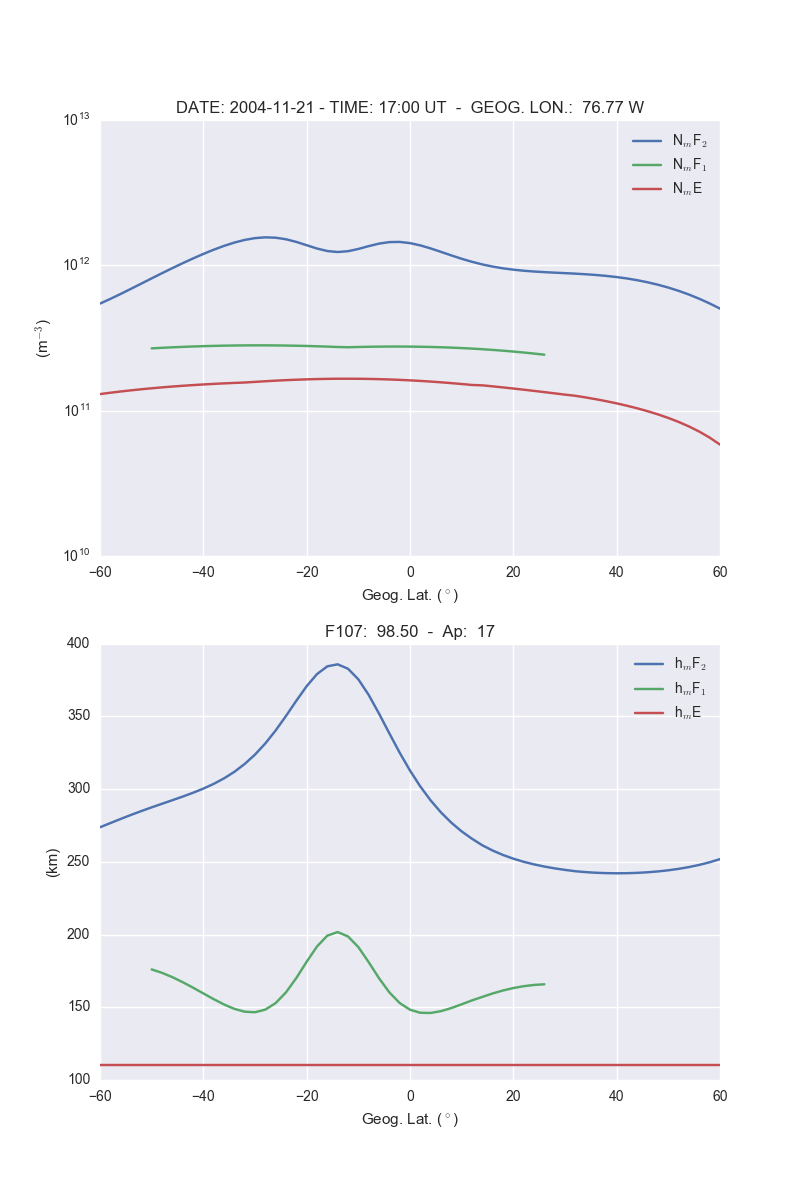
-
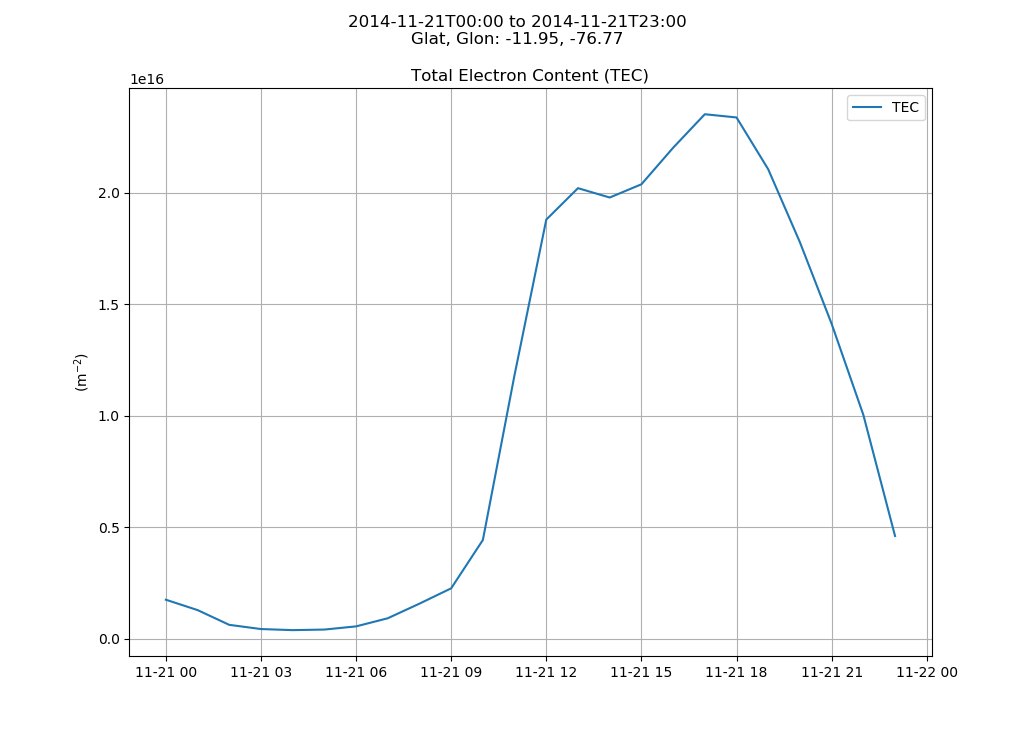
Time profile: plot densities and height at the peak of F2, F2, and E regions vs UTC
python -m iri2016.time 2014-11-21 2014-11-22 1 -11.95 -76.77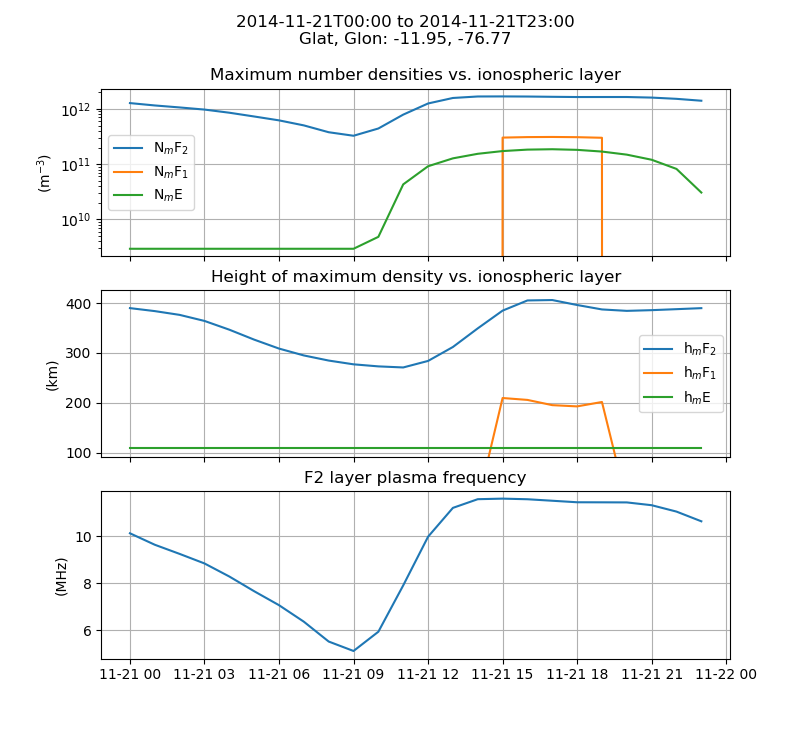

-
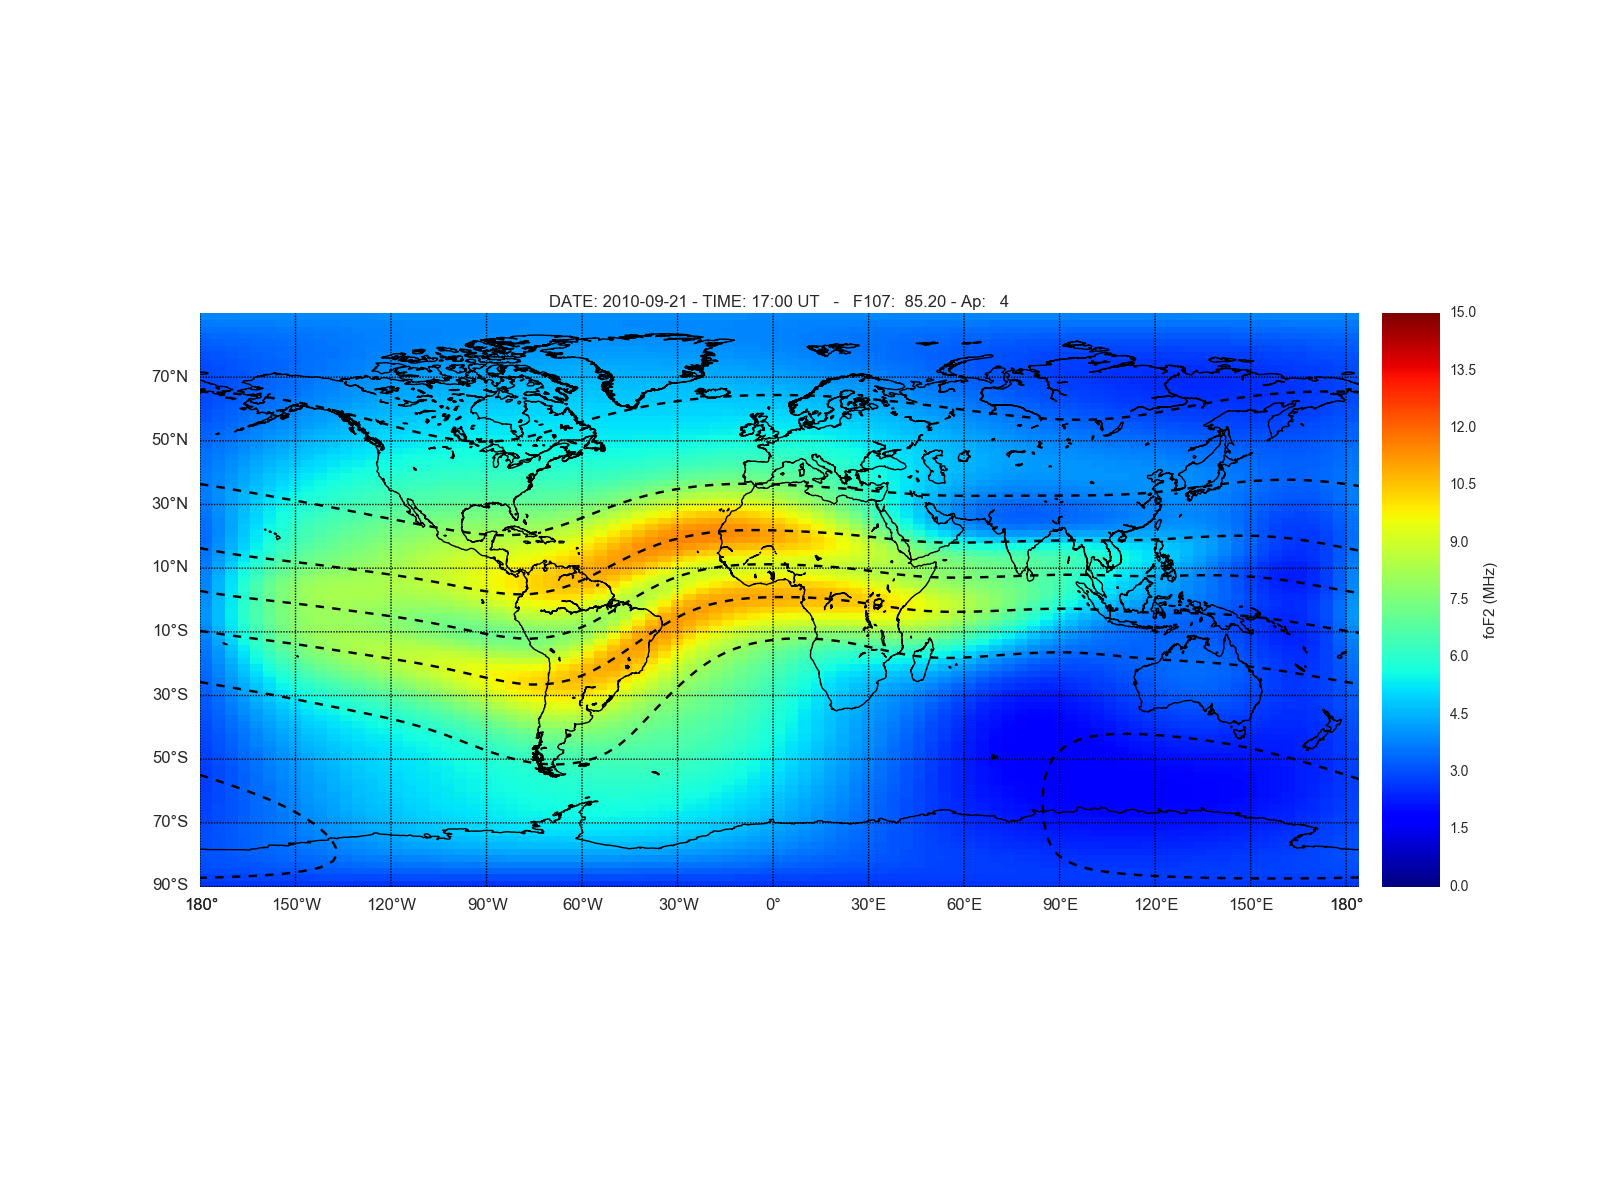
Latitude vs Longitude: plot of foF2 a function of geographic latitude and longitude
setting JF flags
irisub.for has a few dozen logical flags stored in variable JF. To reconfigure those flags, edit iri2016_driver.f90 and recompile iri2016_driver.exe.
Matlab
IRI2016 is readily accessible from Matlab. From within Matlab verify everything is working by:
TestAll
The Examples directory has simple example use with plots.

Data files
iri2016/iri2016/data/index/{apf107,ig_rz}.dat are
regularly updated.
Currently we don’t auto-update those.


